


Subscription businesses live and die by the numbers, but not just any numbers. The right subscription KPIs reveal exactly where growth is accelerating, where churn is quietly eroding revenue, and where untapped opportunity sits waiting. For any recurring revenue business, ignoring these signals isn't just a missed opportunity; it's a genuine risk.
According to research on subscription business models, sustainable growth depends on continuously measuring the health of customer relationships, not just acquisition numbers. Subscription analytics transforms raw transactional data into strategic clarity, giving teams a shared language for decisions across marketing, product, and finance.
Whether you're managing a Shopify store with recurring billing or scaling a SaaS product, the metrics you track will ultimately shape the business you build. Understanding which KPIs matter, and why it's the essential first step.

Key Subscription KPIs to Monitor
Knowing which KPIs for subscription business success you should prioritize is half the battle. While dozens of metrics exist, a focused set of indicators gives leadership a clear, actionable picture of business health without creating data overload.
According to Cratejoy's subscription KPI guide, the most effective operators track metrics across three dimensions: revenue, retention, and acquisition efficiency. These pillars capture the full subscriber lifecycle — from first purchase through long-term loyalty.
Core metrics worth monitoring include:
- Monthly Recurring Revenue (MRR) — predictable revenue baseline
- Churn Rate — the speed at which subscribers leave
- Customer Lifetime Value (LTV) — total revenue per subscriber
- Customer Acquisition Cost (CAC) — spend required to win each new subscriber
- Payback period — how long it takes to recoup CAC through subscription revenue
The payback period deserves particular attention. A shorter payback period signals capital efficiency, letting you reinvest faster and scale sustainably. Understanding how a subscription model generates recurring revenue is essential context before diving deeper into each metric.
Each of these indicators tells part of the story, starting with MRR, the financial heartbeat of every subscription business.
Monthly Recurring Revenue (MRR)
Monthly Recurring Revenue is the heartbeat of every subscription business, the single number that tells you whether the engine is running or sputtering. Among all subscription metrics, MRR stands out because it normalizes revenue across billing cycles, giving you a consistent, comparable figure month over month.
MRR isn't a monolith, though. Breaking it down reveals the story behind the trend:
- New MRR — revenue from newly acquired subscribers
- Expansion MRR — additional revenue from upgrades or add-ons
- Churned MRR — revenue lost from cancellations
- Net New MRR — the combined result of all three
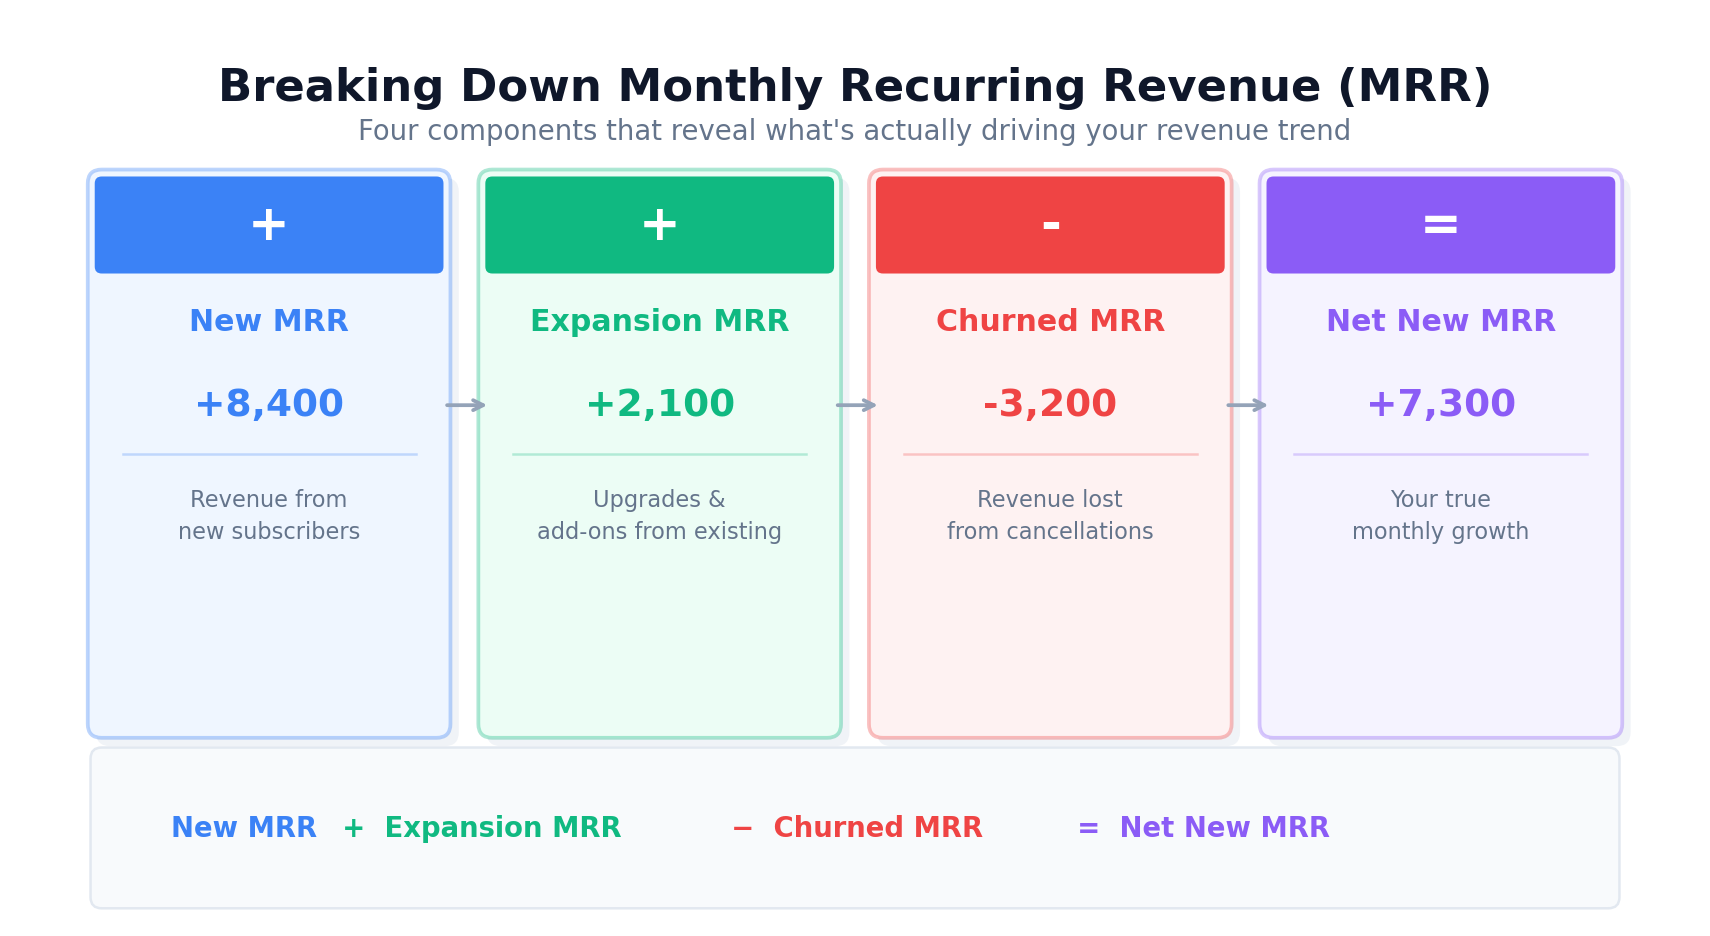
In practice, a healthy subscription business grows Net New MRR steadily while keeping Churned MRR in check. According to RevenueCat's guide to subscription KPIs, tracking MRR alongside your trial conversion rate is essential, unconverted trials silently suppress growth that your top-line numbers might otherwise mask.
MRR growth is only meaningful when you understand what's driving it. That nuance sets up a natural next question: what's the long-term value of the subscribers fueling that revenue?
Customer Lifetime Value (LTV)
If Monthly Recurring Revenue (MRR) tells you how much your business earns each month, Customer Lifetime Value (LTV) tells you how much each customer relationship is ultimately worth. It's the total revenue you can expect from a single subscriber before they cancel, and it's one of the most powerful numbers in answering the broader question: what are subscription KPIs actually for? They exist to help you make smarter growth decisions, and LTV sits at the center of that.
The standard formula is straightforward:
LTV = Average Revenue Per User (ARPU) ÷ Churn Rate
A common pattern is that businesses underinvest in retention because they're focused on acquisition, yet improving LTV almost always delivers stronger returns than chasing new sign-ups.
LTV becomes especially actionable when measured against Customer Acquisition Cost (CAC). A healthy LTV:CAC ratio is typically 3:1 or higher. Falling below that threshold signals your unit economics are under pressure. If you're building on Shopify, understanding these ratios can help you choose tools that support long-term growth rather than just short-term conversions.
One important caveat: LTV is a projection, not a guarantee. It's only as reliable as the churn data feeding into it, which is exactly what we'll explore next.
Churn Rate
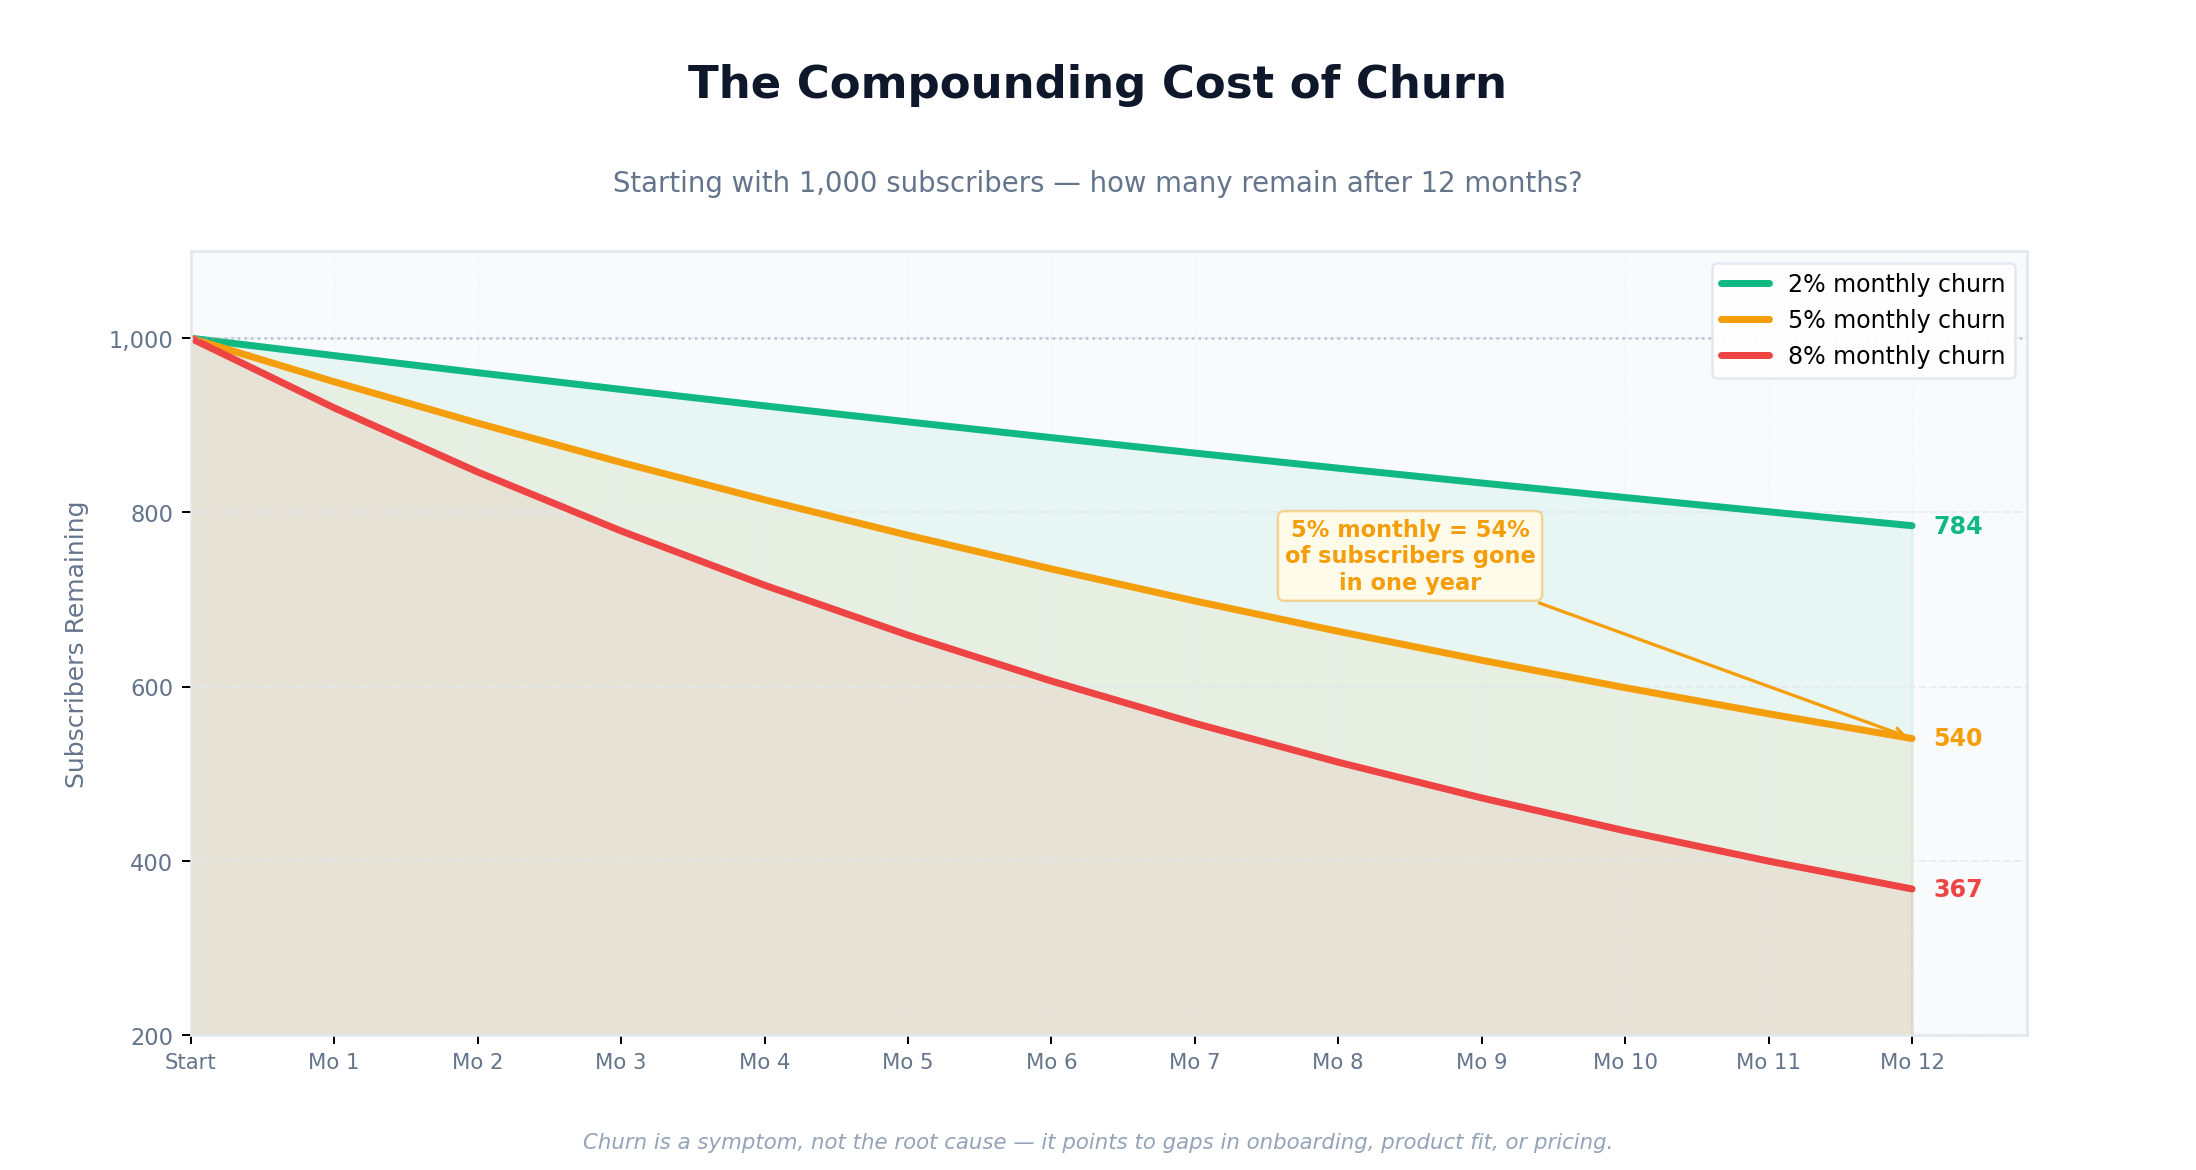
While MRR and LTV reveal what your business is earning and what each customer is worth, churn rate exposes what you're losing — and it's often the metric that quietly undermines growth. Churn rate measures the percentage of subscribers who cancel within a given period, and even modest levels compound painfully over time. A 5% monthly churn rate means losing over half your subscriber base within a year.
There are two critical variants to understand:
- Customer Churn — the percentage of subscribers who cancel
- Revenue Churn — the percentage of MRR (or Annual Recurring Revenue (ARR)) lost, accounting for downgrades
Revenue Churn is often the more telling figure. A common pattern is that losing a few high-value accounts hurts far more than the raw cancellation numbers suggest.
Churn is best understood as a symptom, not a problem itself, it signals deeper issues in product fit, onboarding, or pricing. Knowing how to track subscription metrics at a granular level, including churn by cohort or acquisition channel, helps pinpoint exactly where subscribers are falling off. That diagnostic clarity sets the stage for the next critical question: what did it cost to acquire those customers in the first place?
Customer Acquisition Cost (CAC)
Understanding churn rate makes one thing clear: retaining subscribers is only half the battle. The other half is acquiring them efficiently. That's where Customer Acquisition Cost (CAC) becomes essential.
CAC measures the total cost of winning a single new customer, factoring in marketing spend, sales expenses, and any promotional incentives. The formula is straightforward:
CAC = Total Acquisition Spend ÷ Number of New Customers Acquired
In practice, a healthy subscription business maintains a CAC that's significantly lower than its LTV. A common benchmark is an LTV:CAC ratio of 3:1 or higher, meaning each customer generates at least three times what it cost to acquire them.
This is also why track MRR and churn rate together with CAC matters so much: if churn is high, LTV shrinks, and suddenly that acquisition cost looks far less sustainable. The three metrics are deeply interdependent.
One practical approach is to monitor these ratios through dedicated analytics rather than spreadsheets, especially as your subscriber base scales. Tracking CAC by channel also reveals which acquisition sources deliver the most efficient growth, a detail that becomes invaluable when optimizing ad budgets. Knowing where your best customers come from is just as important as knowing what they cost.

The Role of Analytics in Tracking Subscription KPIs
Knowing which metrics matter is only half the equation — the other half is having the infrastructure to track them reliably. When businesses ask "what KPIs for SaaS subscriptions should I prioritize?", the answer almost always depends on how well their analytics stack captures real-time data across the customer lifecycle.
Modern analytics platforms consolidate metrics like Churn Rate, MRR, LTV, and CAC into unified dashboards, making it easier to spot correlations that manual reporting would miss. For example, a sudden CAC spike alongside rising Churn Rate is a warning signal that's only visible when both metrics are monitored together.
If you're running a Shopify storefront, understanding how recurring billing works is foundational before layering analytics on top. The right tooling — including dedicated subscription management apps — can automate data collection and surface actionable insights automatically.
That said, even sophisticated analytics tools can't compensate for misinterpreted metrics — which leads to some surprisingly common mistakes worth addressing.
Common Misconceptions About Subscription Metrics
Even with the right analytics infrastructure in place, many businesses misinterpret what their numbers are actually telling them. These blind spots can quietly derail growth — even when dashboards look healthy on the surface.
One of the most persistent myths is that high revenue automatically signals a thriving subscription business. In practice, revenue growth paired with rising churn is a slow leak, not a success story. You're filling a bucket with a hole in it.
Another common error is treating Lifetime Value LTV as a fixed number. LTV shifts constantly based on pricing changes, churn behavior, and upsell activity — it should be revisited regularly, not calculated once and filed away.
Businesses also tend to over-prioritize a single metric when identifying the most important KPIs for subscription business success. In reality, no metric exists in isolation. MRR, churn, CAC, and LTV only become meaningful when interpreted together. Focusing on one while ignoring the others creates a distorted picture.
Understanding these misconceptions sets the stage for seeing how these metrics play out in real-world scenarios, which is exactly where the real learning happens.
Example Scenarios: Applying KPIs in Real Business Situations
Abstract metrics become far more useful when grounded in practical context. Consider how different subscription businesses might interpret the same data differently.
Example scenario: A DTC coffee brand notices strong MRR growth but a rising churn rate. Digging deeper, they find Average Revenue Per User (ARPU) is climbing because retained customers are upgrading, yet new subscribers are churning within 60 days. The insight shifts their strategy from acquisition spend toward onboarding improvements, directly addressing early drop-off.
Example scenario: A SaaS company sees flat subscriber counts but improving LTV. Rather than panicking, leadership recognizes that retention-focused strategies are compounding revenue quality over raw growth.
In practice, KPIs rarely tell a single story. The real skill is reading metrics in combination, churn alongside ARPU, MRR alongside CAC payback period. Businesses that treat each number in isolation often draw the wrong conclusions, as earlier sections on common misconceptions highlighted.
Of course, even thoughtful interpretation has its limits, which is worth exploring next.
Limitations and Considerations
No set of SaaS metrics tells the complete story on its own. Every KPI carries inherent limitations that can mislead decision-making if teams treat numbers in isolation.
A few critical caveats worth keeping in mind:
- Lagging vs. leading indicators — Metrics like MRR reflect what already happened, not what's coming. Pairing them with leading signals (trial-to-paid conversion rates, feature adoption) creates a more balanced view.
- Context dependency — Benchmarks vary significantly by industry, price point, and business stage. A "healthy" churn rate for an enterprise SaaS product looks very different from a consumer subscription box.
- Data quality issues — Metrics are only as reliable as the systems capturing them. Inconsistent tagging, billing errors, or siloed platforms can quietly corrupt your numbers.
Metrics without strategy are just noise. The goal isn't to track everything, it's to track the right things for your specific growth stage. If you're scaling a Shopify subscription business, tools with built-in analytics and automation reduce these data quality risks considerably.
With these limitations in mind, the following key takeaways distill what actually matters most.
Key Takeaways
Tracking subscription KPIs isn't about monitoring numbers for their own sake, it's about building a clearer picture of how healthy your recurring revenue engine truly is. The metrics covered throughout this guide each illuminate a different dimension of that engine: acquisition, retention, monetization, and long-term value.
A few principles worth carrying forward:
- No single metric tells the whole story. Pair revenue metrics with retention indicators for a balanced view.
- Context shapes meaning. Benchmarks vary by industry, price point, and growth stage.
- Trends matter more than snapshots. A metric moving in the right direction consistently outweighs a strong single-period result.
- Act on what you measure. Tracking without follow-through creates data clutter, not insight.
The brands that win with subscriptions treat their metrics as a feedback loop, not a report card. If you're evaluating tools to support that process, understanding what each pricing tier enables can help match your analytics needs to the right foundation, which is exactly where we'll look next.
Where to Look Next
Mastering subscription KPIs isn't a destination, it's an ongoing practice. Customer Retention remains the gravitational center of every metric covered in this article, from churn rate and LTV to net revenue retention and engagement scores. When retention improves, almost every other number follows.
The most effective subscription businesses treat their KPI stack as a living system. They revisit benchmarks as they scale, question metrics that feel comfortable, and stay alert to the gaps between what data shows and what customers actually experience.
The clearest path forward is simple: start with the metrics closest to revenue health, build consistent measurement habits, and layer in complexity as your understanding deepens.
Sustainable growth doesn't come from tracking everything, it comes from tracking the right things, acting on what you learn, and iterating without hesitation.